
The Division of Coastal Management shall be the only State agency authorized to develop rates of sea-level rise and shall do so only at the request of the Commission. These rates shall only be determined using historical data, and these data shall be limited to the time period following the year 1900. Rates of sea-level rise may be extrapolated linearly to estimate future rates of rise but shall not include scenarios of accelerated rates of sea-level rise.This is the text of the notorious, anti-science, anti-coastal community bill that was originally floated in the North Carolina state senate. A revised version of that bill is now under review, with new language that now mandates that:
source (emphasis mine)
The Commission and the Division of Coastal Management may collaborate with other State agencies, boards, commissions, other public entities, or institutions when defining sea-level rise or developing rates of sea-level rise. These rates shall be determined using statistically significant, peer-reviewed historical data generated using generally accepted scientific and statistical techniques. Historic rates of sea-level rise may be extrapolated to estimate future rates of rise but shall not include scenarios of accelerated rates of sea-level rise unless such rates are from statistically significant, peer-reviewed data and are consistent with historic trends.While this new language is almost certainly an improvement over the old bill, which was heavily supported by a lobbying group for coastal developers and heavily opposed by organizations that actually care what happens to the Carolina coastline and its historic communities, it is still problematic. By problematic, I mean wrong. And by wrong I mean that by refusing to allow accelerated estimates of sea level rise, it explicitly ignores all the best available science and contradicts 130 millenia of historic precedent.
source (emphasis mine)
Before I start discussing the data, I strongly recommend reading John Bruno’s Sea Level Rise 101 over at The SeaMonster, and his latest update: The NC sea level rise saga: mid-week update.
First, I’m going to take a step back in time. Let’s say, oh, about 130,000 years. Take a look at the graph below (which is from Rapid Changes in Glaciers and Ice Sheets and Their Impacts on Sea Level in the Encyclopedia of Earth:

(a)
Record of sea-level change over the last 130,000 years. Thick blue line
is reconstruction from δ18O records of marine sediment cores through
regression analyses (Waelbroeck et al., 2002), with ±13 m error shown by
thin gray lines. The × symbols represent individually dated shorelines
from Australia (Stirling et al., 1995, 1998), New Guinea (Edwards et
al., 1993; Chappell, 2002; Cutler et al., 2003), Sunda Shelf (Hanebuth
et al., 2000), Bonaparte Gulf (Yokoyama et al., 2000), Tahiti (Bard et
al., 1996), and Barbados (Peltier and Fairbanks, 2006). (b) Rate of sea
level change (mm a-1) and equivalent freshwater flux (Sv, where 1 Sv =
106 m3 s-1 = 31,500 Gt a-1) derived from sea-level record in (a).
Horizontal gray bars represent average rates of sea level change during
the 20th century (lower bar) and projected for the end of the 21st
century (upper bar) (Rahmstorf, 2007). source
“But Andrew!” you might ask, “this graph covers more than 100,000 years! Isn’t it possible that on the scale of human civilization, a linear regression would be reasonable?” Great question! Let’s take a look at a narrower time series, say, since the last glacial maximum.

Image created by Robert A. Rohde / Global Warming Art. More details here.
So now we get to the heart of the claims by NC-20 and other lobbying groups that want to stick their feet, heads, and housing, in the sand:
Contrary to the predictions of Climate Movement activists, the best scientific evidence is that theThis argument is based on a now heavily debunked paper (see here, here, and here) that argues, based on cherry-picked data, that sea level rise has not accelerated over the last 70-odd years. So let’s look at one more graph:
last 3/4 century of CO2 emissions and other human activities have resulted in no acceleration
(increase) in rate of sea level rise at all.
source
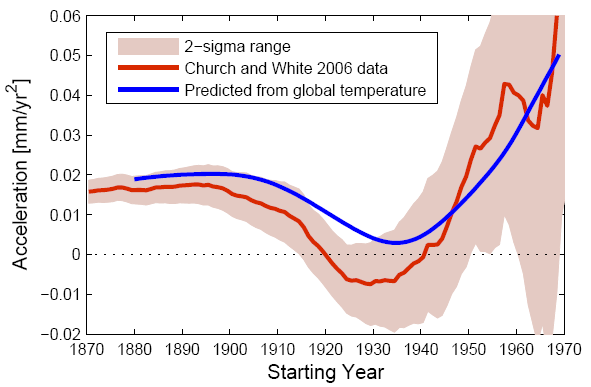
Acceleration
of sea-level rise (i.e., twice the quadratic coefficient) from
different starting years up to 2001 in the global tide gauge data set of
Church and White (2006; red line with uncertainty band). Note that
after ~1960 the calculation gets excessively ‘noisy’ because the time
interval gets too short to robustly compute acceleration. I graphed this
right away after reading the Houston & Dean paper, and a few days
later Tamino independently came up with a similar plot – it’s the
obvious thing to do. The blue line shows the same quantity from the
sea-level hindcast of Vermeer & Rahmstorf (2009) computed from
global temperature data. From RealClimate.
To put it another way, 130,000 years of data suggest that the least rational, least effective model for understanding changes in sea level is a linear extrapolation.
[Comment Note: The reality of anthropogenic global warming is not up for debate.
No comments:
Post a Comment